
Surprising Math Lesson: Calculating the Odds of a Second Date Using Real-Life Scenarios
Thao Le proves that teaching math is better when it's applied
Author: Thao Le
Thao Le proves that teaching math is better when it's applied
Author: Thao Le
As a math teacher, I’ve always struggled making math relatable to my students. Finding topics that will truly interest them so they learn and have fun at the same time is difficult.
I’ve been teaching for nine years: I’ve taught Algebra 1, Algebra 2, IB Math, Pre-Calculus, Common Core and Geometry. Even though I’ve taught a wide variety of courses over my career, I had never taught a statistics course. I was definitely a newbie teaching this area when I first started. Luckily, probability and statistics was my main emphasis as a graduate student at the University of Utah, so I’ve had a lot of practice in the field.
On day one, I was teaching my students how to categorize different variables in various studies. The objective was for my students to learn how to categorize their variables as either categorical or quantitative data. (Categorical data describes characteristics without using numbers, and quantitative data can be measured using numbers containing units, like feet or meters.)
Instead of standing at the board and just throwing different hypothetical studies at my students, I wanted my students to carry out a study that they would find interesting in real life.
So, I came up with a podcast study that would make my students look at data from a new perspective.

Each day as I drive to work, I listen to a radio show on 96.3 KSCS called “Second Date Update.” The show is about how a person wants to have a second date, but, for whatever reason, never got one—so they call the show for some help.
The class was tasked with categorizing the variables that affected getting a second date as either categorical or quantitative, and calculating the success rate. The first thing that I wanted my students to do was to make a prediction about what they thought was going to happen. A lot of my students thought that the success rate wouldn’t be that great and that it would be “very comical.” They were partially correct.
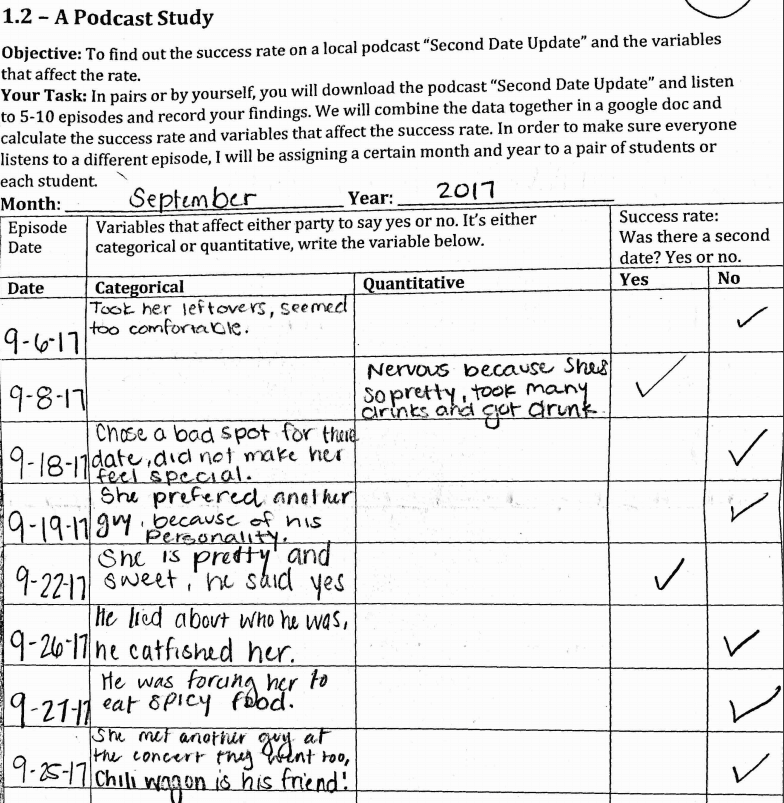
Students worked together in pairs and listened to a handful episodes on their cell phones or laptops. To ensure that we were going to have different dates, I assigned each pair with a month and year, and they could pick the episodes that they found interesting to listen to.
Students listened to the episode and determined the variables that caused either party to say "yes" or "no" as either "categorical" or "quantitative." After they determined the variable, they recorded if there was a second date as either “yes” or “no.” We compiled the data in Google Docs so we could easily analyze it in real time.
Our results were shocking.
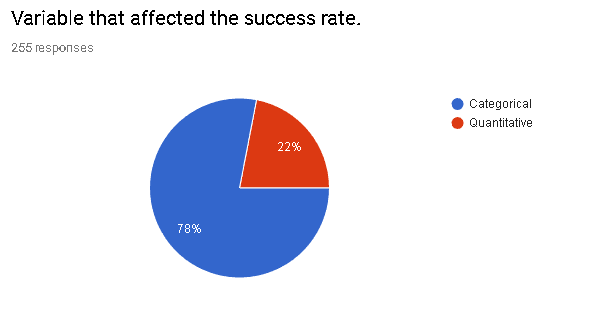
Out of 255 calls, students stated that 78% of the reasons for not having a second date were characterized as categorical data, such as the other person being too arrogant or being a partier, having a different religious preference, or not having chemistry with them.
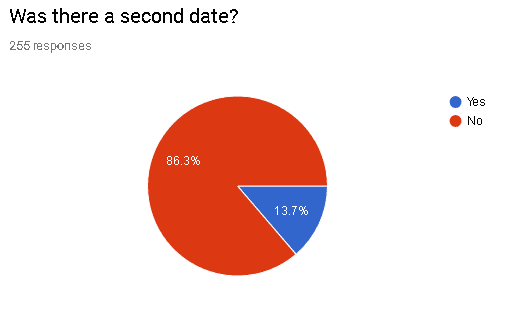
My students also stated that 22% of the calls were characterized as quantitative data, such as age, height, having too many drinks or calling too many times. The success rate for a second date was 13.7%, which was low, but there was still a chance for a person to get a second date.
I asked my students two questions after the study:
What did they find interesting about the Podcast Study?
What did they learn from the Podcast Study?
My students answered truthfully, and the responses were educational and practical:
“There are many factors that can affect a person’s choice, and based on your choice it can be made into researchable data for someone to observe and study.”
“I learned that most people didn’t get a second date.”
“I learned that I should make a good impression on a first date, because first impressions are really important.”
“I learned that people are crazy and weird.”
“I learned that categorical variables are more important, because they are specific to the person.”
“It was a fun study. I had so much fun, and it was funny.”
“I learned that statistics can happen in any situation.”
“There’s a lot of statistics in the real world.”
Doing this study showed my students that math can be fun. My advice for teachers who are afraid of doing something that is outside of the conventional teaching method is to just do it. Anything that you do out of the ordinary can have a greater impact on your students’ lives. I plan to continue to find more real-life studies for my students to carry out so that they can truly be engaged and enjoy math.
Are you passionate about statistics—or any other subject—that doesn't get much love in the classroom? Take the roadmap quiz to see if teaching is up your alley.